Home prices imedian, per sq ft
AED 2,018
+12.8% vs last year
Apr 2025Oct 2026
+24.6% over two years · Dubai: +5.5% in a year

Market pulse · DLD data
Dubai Land Department figures for the communities where the group is active.
By community
Updated Dubai Land Department · 12 months to October 2026 vs the 12 months before
How fast home prices are rising, what homes rent for, and how many people are buying and renting — in the areas where we build homes.
AED 2,018
+12.8% vs last year
Apr 2025Oct 2026
+24.6% over two years · Dubai: +5.5% in a year
AED 83
+3.5% vs last year
AED 68typical rangeAED 102
Middle half of 9,306 registered leases in 12 months.
sq ft
Ranges from registered sales and leases in Al Jaddaf. Not a valuation.
People signing new leases: the tenants an investor buys for.
AED 2,442
+0.2% vs last year
Apr 2025Oct 2026
+6.0% over two years · Dubai: +5.5% in a year
AED 111
+0.5% vs last year
AED 89typical rangeAED 140
Middle half of 19,418 registered leases in 12 months.
sq ft
Ranges from registered sales and leases in Business Bay. Not a valuation.
People signing new leases: the tenants an investor buys for.
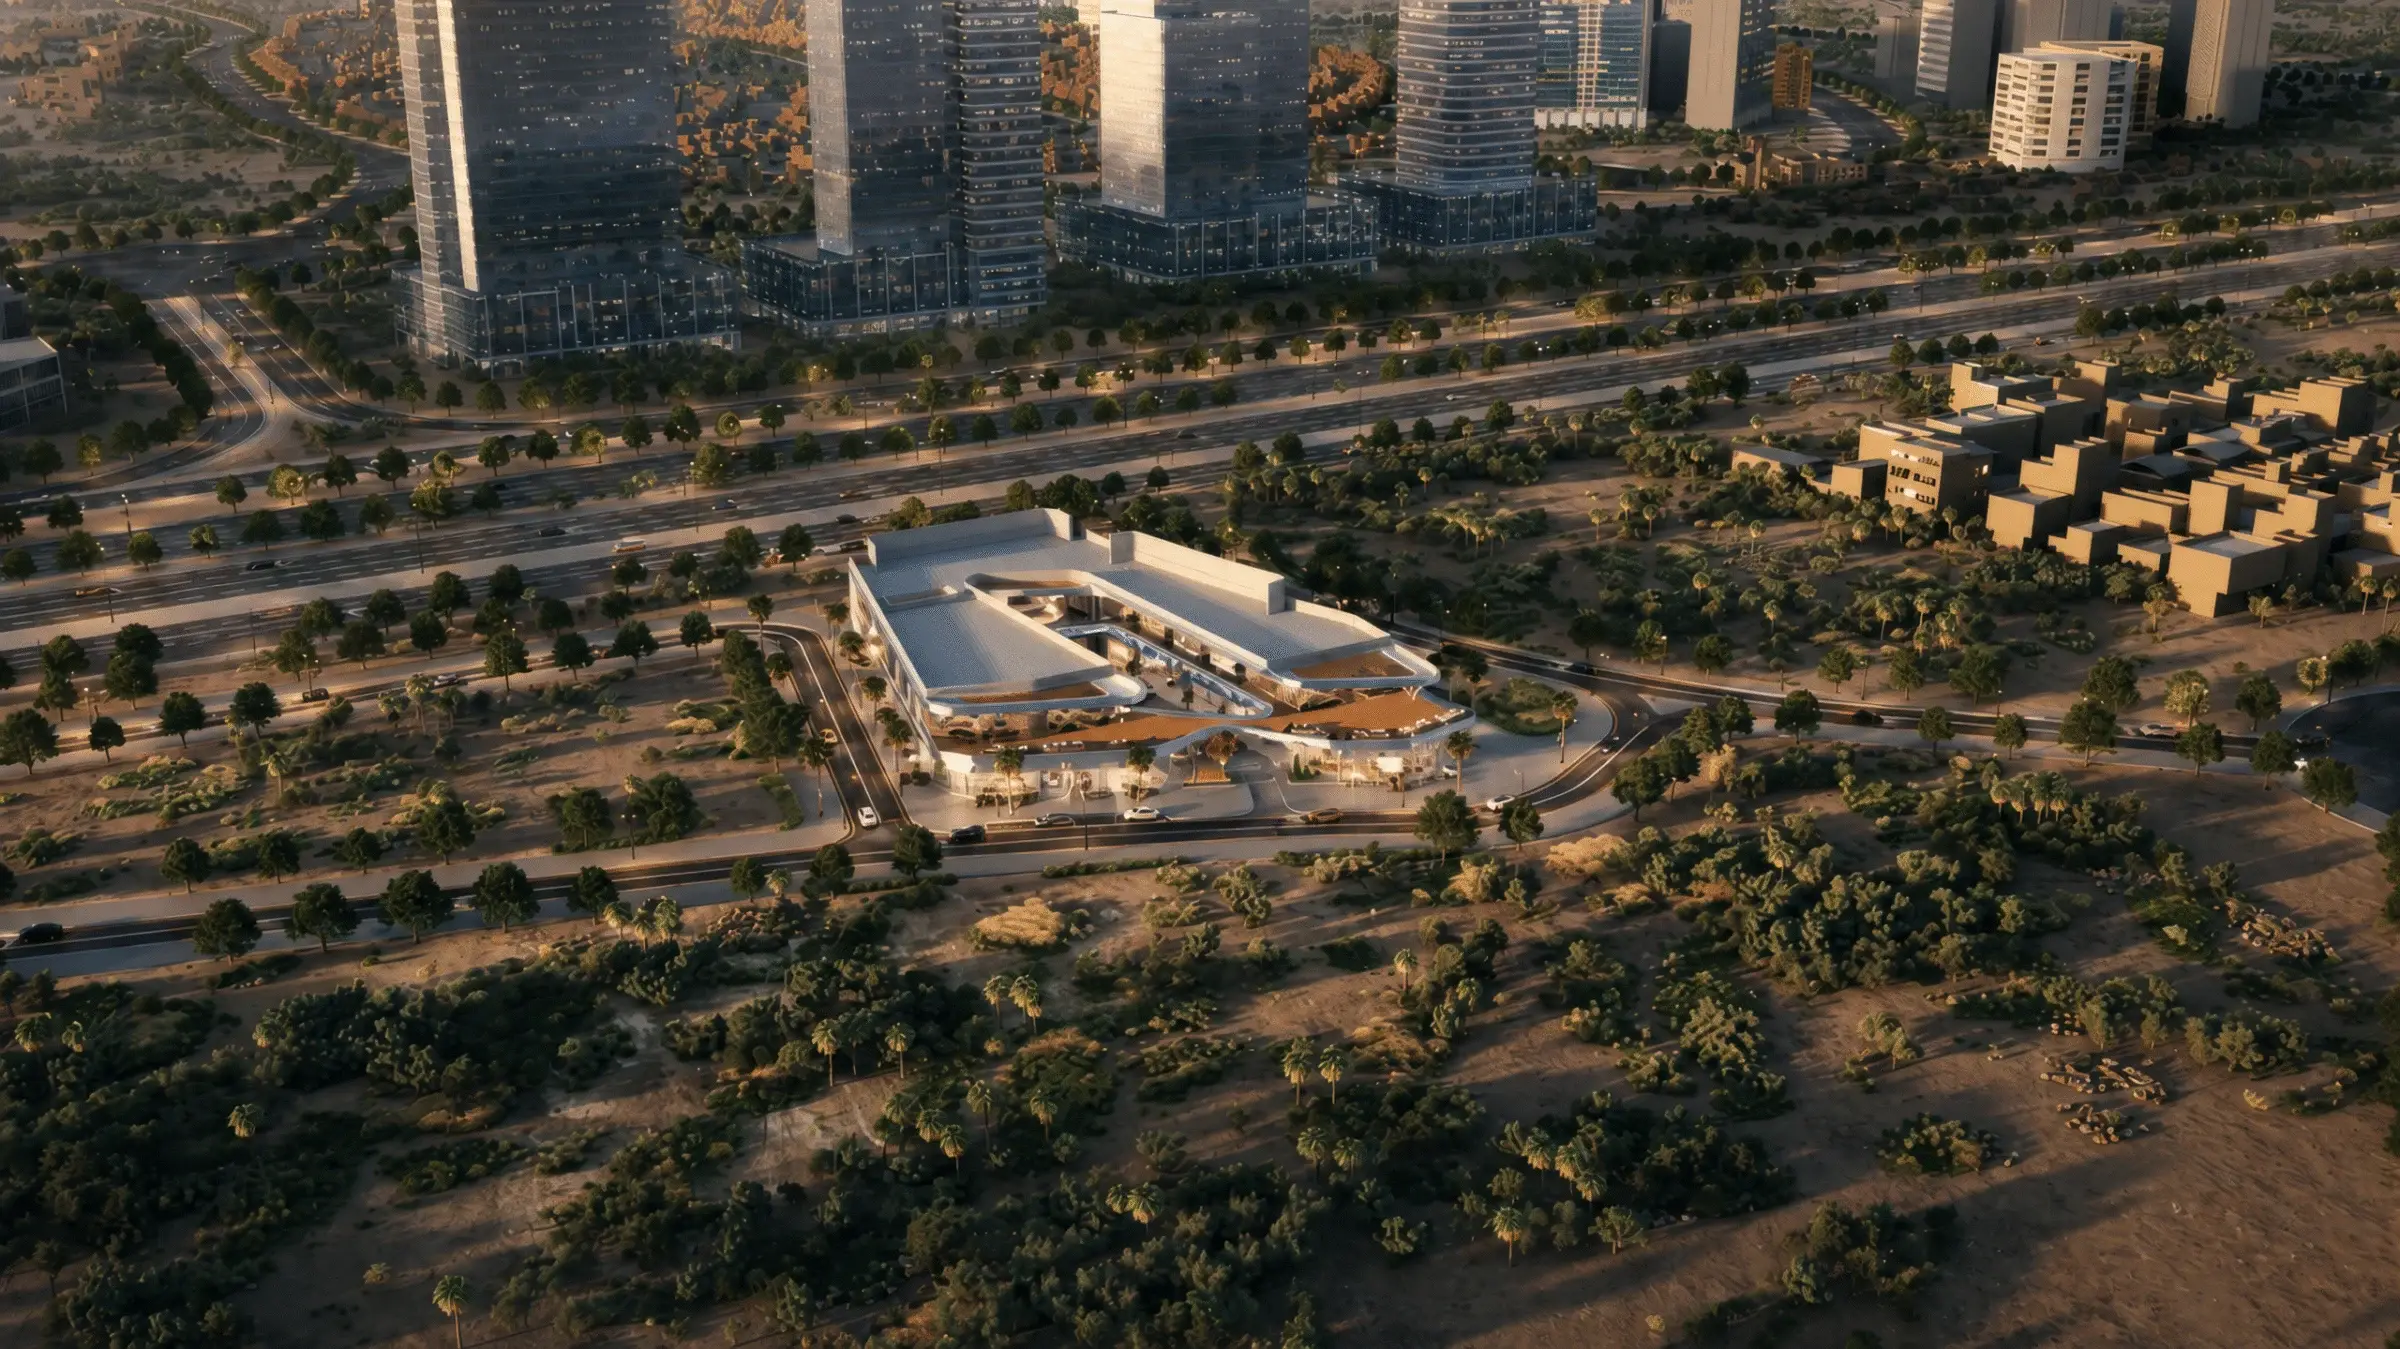
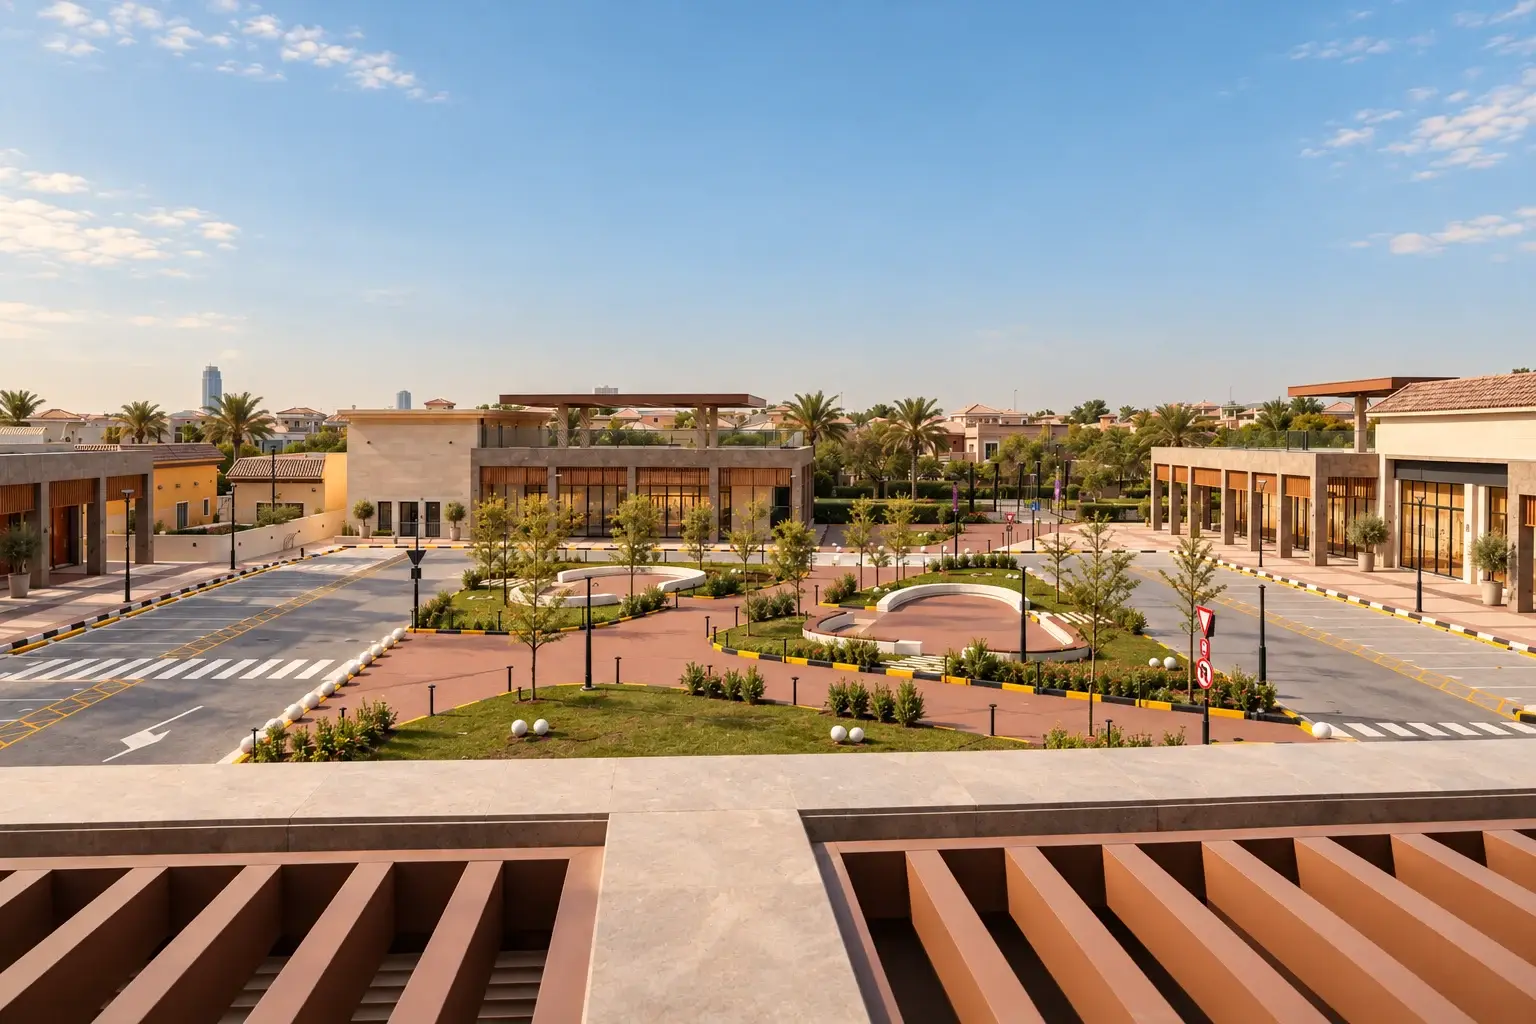
Who lives around each of our centres and what shops rent for there — the numbers a brand looks at before choosing a location.
The catchment i
~360,000 residents
live within a short drive of Le Meryeme – Liwan, in 110,825 homes registered with the Dubai Land Department.
| Community | Homes | Est. residents |
|---|---|---|
| Liwan · Falcon CityThe community itself | 14,261 | ~47,600 |
| International CityA short drive | 35,836 | ~115,100 |
| Majan · Living LegendsNext door | 29,278 | ~96,200 |
| Dubai Silicon OasisNext door | 28,692 | ~92,600 |
| Academic CityA short drive | 2,758 | ~8,900 |
| Total catchment | 110,825 | ~360,000 |
AED 244
+3.2% vs last year
AED 205typical rangeAED 269
Dubai median: AED 178 · Liwan is 37% above. Based on 65 shop leases.
sq ft
From registered shop leases in Liwan. Ask our leasing team for availability and terms.
The catchment i
~349,000 residents
live within a short drive of Le Meryeme – The Villa, in 105,811 homes registered with the Dubai Land Department.
| Community | Homes | Est. residents |
|---|---|---|
| The VillaThe community itself | 1,854 | ~7,700 |
| Dubailand Residence ComplexNext door | 37,215 | ~119,100 |
| Majan · Living Legends · Al BarariNext door | 29,278 | ~96,200 |
| City of ArabiaNext door | 16,619 | ~53,600 |
| Liwan · Falcon CityNext door | 14,261 | ~47,600 |
| Academic CityA short drive | 2,758 | ~8,900 |
| Other villa communities nearbyA short drive | 2,669 | ~11,200 |
| Arabian Ranches 3A short drive | 1,157 | ~4,800 |
| Total catchment | 105,811 | ~349,000 |
AED 152
−2.0% vs last year
AED 110typical rangeAED 210
Dubai median: AED 178 · The Villa is 15% below. Based on 198 shop leases.
sq ft
From registered shop leases in The Villa. Ask our leasing team for availability and terms.
▲ rising▼ falling compared with the same 12 months a year earlier. Source: Dubai Land Department registered sales and leases (new and renewed).
Monthly market report
At the start of each month we read the Dubai Land Department figures for the month before and explain them: the UAE picture, Dubai, our five communities, retail rents and where the opportunities are.