
Dubai residential prices +5.5% and apartment rents +6.2% year on year; 219,538 new apartment leases over 12 months. Residential and neighbourhood retail submarkets, with Dubai Land Department data to October 2026.
Executive summary
- Prices hold despite slower sales. The 12-month median residential price in Dubai stands at AED 1,713 per sq ft, +5.5% year on year, while 11,623 sales worth AED 33.2 billion were registered in October.
- Rental demand remains firm. 219,538 new apartment leases were registered over 12 months (+6%), with median apartment rents +6.2%.
- Al Jaddaf leads the central submarkets. Residential prices are +12.8% year on year, more than double the Dubai average.
- Neighbourhood retail commands a premium. Shop rents in Liwan average AED 244 per sq ft a year, 37% above the Dubai median.
01Macro context
The UAE continues to show two speeds. Real estate transactions in Abu Dhabi reached AED 171.26 billion in the first nine months of 2026, up 76.1% year on year, across 38,483 deals, according to the Abu Dhabi Real Estate Centre. Dubai, more exposed to international sentiment, is moving more slowly this year from the highest base in its history.
In its third-quarter review, Savills reported new-letting apartment rents in some of Dubai’s most active communities, including Business Bay, around 10–13% lower year on year, with early signs of stabilisation. Registered contracts, which include renewals, show a more measured picture: re-pricing is taking place at the margin rather than across the market.
02Dubai transactions
The Dubai Land Department registered 11,623 sales worth AED 33.2 billion in October 2026, compared with 19,714 in October 2025. Off-plan accounted for 58% of sales. Lower volumes alongside stable prices indicate that owners are holding rather than discounting.
Oct 2025 – Oct 2026Same month a year earlier
Source: Dubai Land Department, registered sale transactions.
03Residential market
Residential prices are measured as the median price per sq ft of registered residential sales over rolling 12-month periods, which smooths the month-to-month effect of the mix of units sold.
Source: Dubai Land Department, registered sale transactions.
| Submarket | Price AED / sq ft |
y-o-y | Apartment rent AED / sq ft a year |
y-o-y | New leases 12 months |
|---|---|---|---|---|---|
| Dubai | 1,713 | +5.5% | 75 | +6.2% | 219,538 |
| Al Jaddaf | 2,018 | +12.8% | 83 | +3.5% | 4,138 |
| Business Bay | 2,442 | +0.2% | 111 | +0.5% | 11,386 |
Source: Dubai Land Department; Key Mavens Group Research.
Al Jaddaf
A waterfront district on Dubai Creek between Downtown and the airport, served by the Creek and Al Jadaf metro stations. Residential prices are +12.8% year on year against +5.5% for Dubai; 4,138 new apartment leases were registered over 12 months (+15%). Over two years, prices have risen +24.6%.
Key Mavens Group in this submarketMontageSky Duplexes at Montage
Business Bay
Dubai’s central business district along the Dubai Canal, and one of the most active rental markets in central Dubai. Residential prices are +0.2% year on year against +5.5% for Dubai; 11,386 new apartment leases were registered over 12 months (+15%). Over two years, prices have risen +6.0%.
Key Mavens Group in this submarketTerraces Marasi Drive
04Retail market
Retail rents are measured as the median annual rent per sq ft of registered shop contracts, new and renewed, over 12 months. For neighbourhood retail, the size of the surrounding resident base and the rents achieved in comparable locations are the primary indicators of tenant demand.
Source: Dubai Land Department, registered rent contracts (new and renewed).
| Submarket | Shop rent AED / sq ft a year |
y-o-y | vs Dubai median | Apartment leases 12 months |
|---|---|---|---|---|
| Dubai | 178 | +5.7% | – | 553,625 |
| Liwan (Wadi Al Safa 2) | 244 | +3.2% | +37% | 4,682 |
| The Villa (Wadi Al Safa 5) | 152 | −2.0% | −15% | 7,848 |
Apartment leases: all registered apartment rent contracts in the community over 12 months, an indicator of the resident base. Source: Dubai Land Department; Key Mavens Group Research.
Figure 4 · Catchment: homes and residents within a short drive
All homes registered with the Dubai Land Department in the communities surrounding each centre, with an estimate of residents based on published household sizes.
The catchment i ~360,000 residents live within a short drive of Le Meryeme – Liwan, in 110,825 homes registered with the Dubai Land Department. The catchment i ~349,000 residents live within a short drive of Le Meryeme – The Villa, in 105,811 homes registered with the Dubai Land Department.Community Homes Est. residents Liwan · Falcon CityThe community itself 14,261 ~47,600 International CityA short drive 35,836 ~115,100 Majan · Living LegendsNext door 29,278 ~96,200 Dubai Silicon OasisNext door 28,692 ~92,600 Academic CityA short drive 2,758 ~8,900 Total catchment 110,825 ~360,000 Community Homes Est. residents The VillaThe community itself 1,854 ~7,700 Dubailand Residence ComplexNext door 37,215 ~119,100 Majan · Living Legends · Al BarariNext door 29,278 ~96,200 City of ArabiaNext door 16,619 ~53,600 Liwan · Falcon CityNext door 14,261 ~47,600 Academic CityA short drive 2,758 ~8,900 Other villa communities nearbyA short drive 2,669 ~11,200 Arabian Ranches 3A short drive 1,157 ~4,800 Total catchment 105,811 ~349,000
Liwan
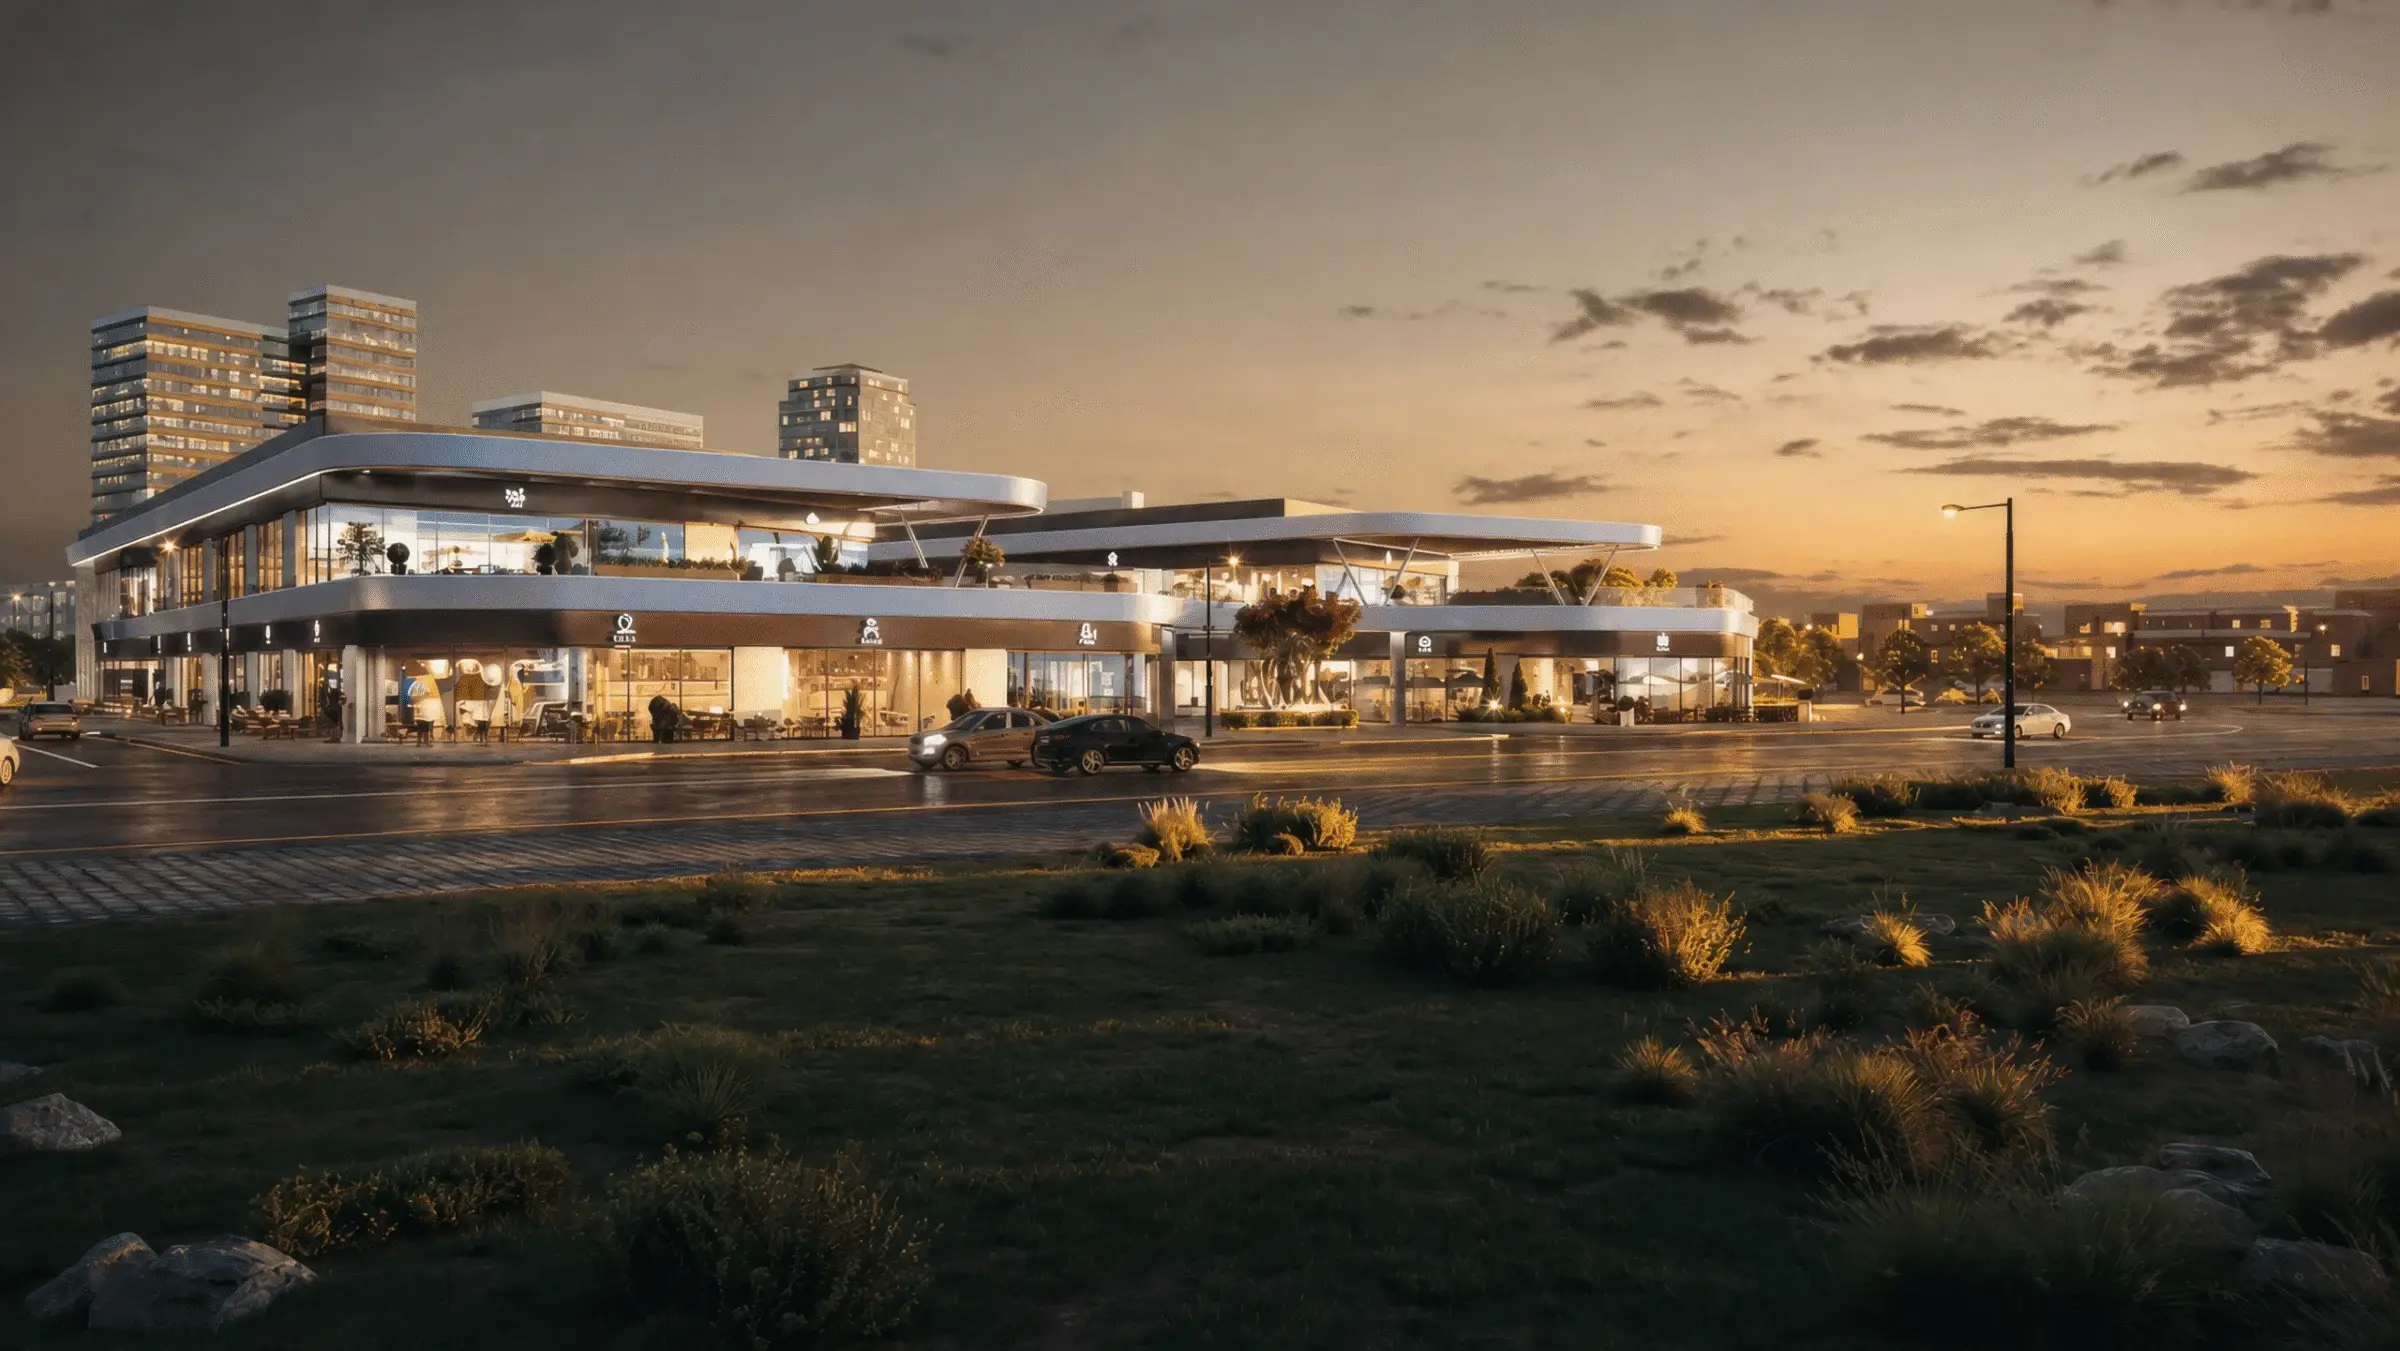
A fast-growing residential district in Wadi Al Safa 2, home to Le Meryeme – Liwan, a 113,000 sq ft community mall anchored by LuLu and scheduled to open in the second quarter of 2027. Shop rents average AED 244 per sq ft a year, above the Dubai median of AED 178, with 4,682 apartment leases registered in the community over 12 months.
Key Mavens Group in this submarketLe Meryeme – Liwan
The Villa
An established villa community in Wadi Al Safa 5, served by Le Meryeme – The Villa. Shop rents average AED 152 per sq ft a year, below the Dubai median of AED 178, with 7,848 apartment leases registered in the community over 12 months.
Key Mavens Group in this submarketLe Meryeme – The Villa
05Outlook
- A seasonal pick-up in November and December.
- Pricing discipline: correctly priced stock continues to transact.
- Community and neighbourhood retail, where rents continue to rise.
Methodology
All transaction and rent data are Dubai Land Department (DLD) open data. Residential prices: median price per sq ft of registered residential sales over rolling 12-month periods. Rents: median annual rent per sq ft of registered rent contracts, new and renewed, over 12 months. Recent months may be revised as late registrations are recorded; rents in smaller communities rest on fewer contracts. DLD area names: Al Jadaf (Al Jaddaf), Business Bay, Wadi Al Safa 2 (Liwan), Wadi Al Safa 5 (The Villa). Macro context is attributed to the sources named in the text.
Disclaimer
This report is published for general information only. It does not constitute investment, financial, legal or tax advice, or an offer or solicitation to buy, sell or lease any property. While prepared from sources believed to be reliable, no representation or warranty is given as to its accuracy or completeness, and Key Mavens Group accepts no liability for any loss arising from its use. Past performance is not a reliable indicator of future results.
Research and media enquiries: contact Key Mavens Group.
Newsroom
More from the group
-
 Key Mavens Group Signs LuLu Retail as Anchor Tenant at Le Meryeme Mall – Liwan
Read →
-
 Key Mavens Group ResearchIssue 05Dubai Property Market ReportSeptember2026
Dubai Property Market Report: September 2026
Read →
-
 Key Mavens Group ResearchIssue 04Dubai Property Market ReportAugust2026
Dubai Property Market Report: August 2026
Read →