
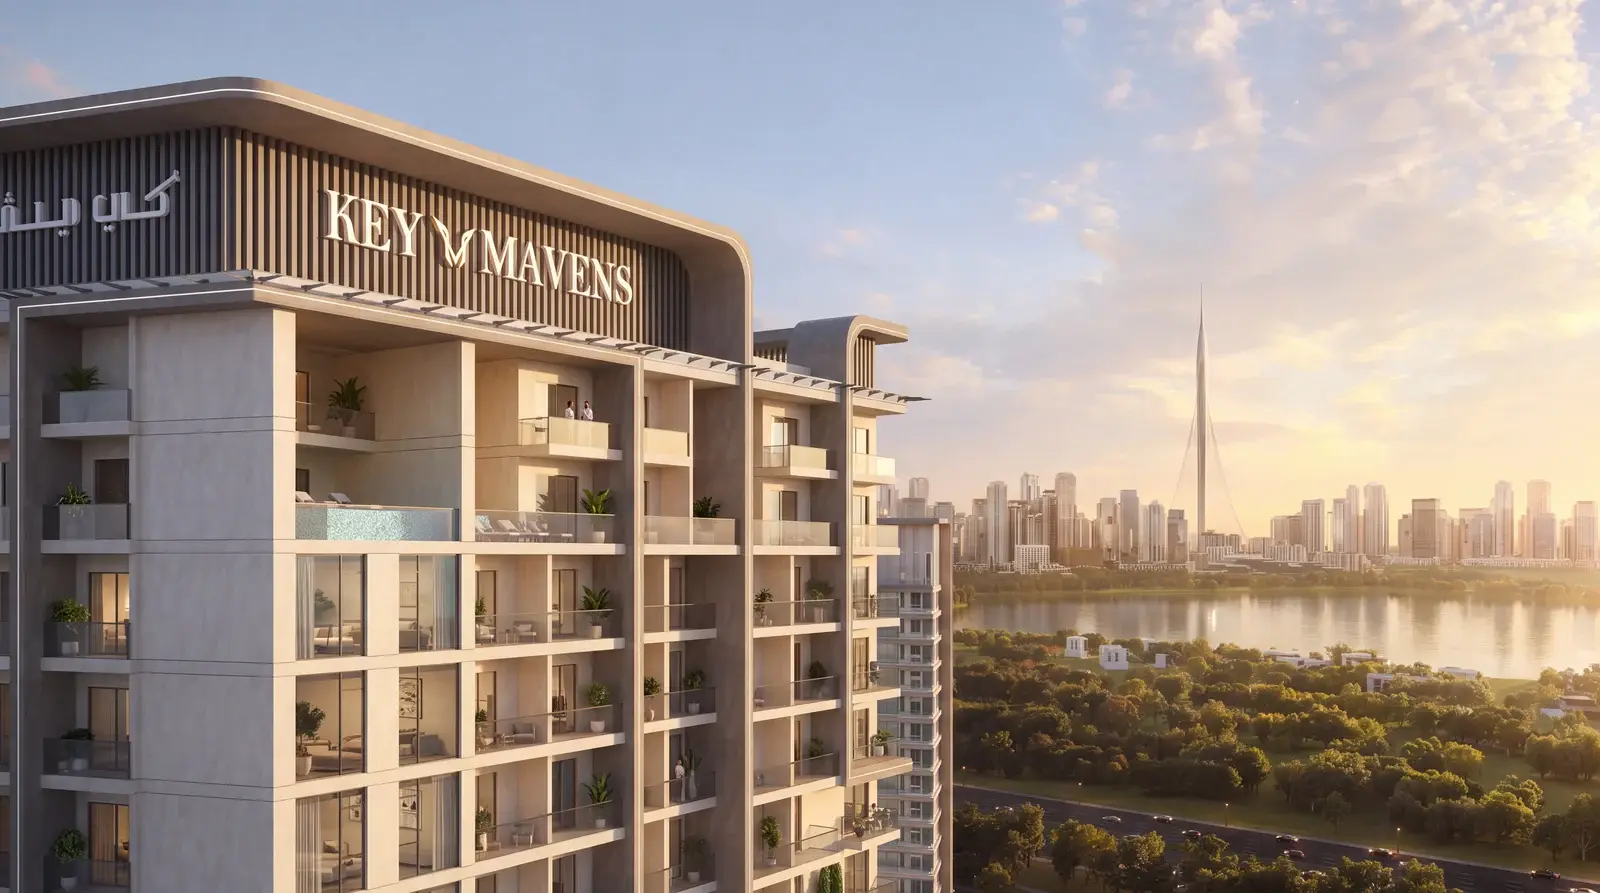
Dubai residential prices +10.4% and apartment rents +8.3% year on year; 206,870 new apartment leases over 12 months. Residential and neighbourhood retail submarkets, with Dubai Land Department data to May 2026.
Executive summary
- Prices hold despite slower sales. The 12-month median residential price in Dubai stands at AED 1,716 per sq ft, +10.4% year on year, while 10,446 sales worth AED 29.4 billion were registered in May.
- Rental demand remains firm. 206,870 new apartment leases were registered over 12 months (+3%), with median apartment rents +8.3%.
- Al Jaddaf leads the central submarkets. Residential prices are +21.3% year on year, more than double the Dubai average.
- Neighbourhood retail commands a premium. Shop rents in Liwan average AED 237 per sq ft a year, 34% above the Dubai median.
01Macro context
May was the first full month of relative calm after the regional conflict that began at the end of February. The ceasefire agreed in early April broadly held, although tension around shipping in the Strait of Hormuz remained in the headlines. Buyers who had paused in March and April began to return, with longer decision cycles, wider comparison and firmer negotiation.
Macro indicators for the UAE remained steadier than Dubai’s transaction data. In its spring outlook the Central Bank of the UAE projected real GDP growth of 5.6% for 2026, and Abu Dhabi reported a record first quarter for real estate.
02Dubai transactions
The Dubai Land Department registered 10,446 sales worth AED 29.4 billion in May 2026, compared with 18,561 in May 2025. Off-plan accounted for 73% of sales. Lower volumes alongside stable prices indicate that owners are holding rather than discounting.
May 2025 – May 2026Same month a year earlier
Source: Dubai Land Department, registered sale transactions.
03Residential market
Residential prices are measured as the median price per sq ft of registered residential sales over rolling 12-month periods, which smooths the month-to-month effect of the mix of units sold.
Source: Dubai Land Department, registered sale transactions.
| Submarket | Price AED / sq ft |
y-o-y | Apartment rent AED / sq ft a year |
y-o-y | New leases 12 months |
|---|---|---|---|---|---|
| Dubai | 1,716 | +10.4% | 73 | +8.3% | 206,870 |
| Al Jaddaf | 2,006 | +21.3% | 83 | +5.8% | 3,685 |
| Business Bay | 2,577 | +10.2% | 113 | +6.1% | 9,832 |
Source: Dubai Land Department; Key Mavens Group Research.
Al Jaddaf
A waterfront district on Dubai Creek between Downtown and the airport, served by the Creek and Al Jadaf metro stations. Residential prices are +21.3% year on year against +10.4% for Dubai; 3,685 new apartment leases were registered over 12 months (+9%).
Key Mavens Group in this submarketMontageSky Duplexes at Montage
Business Bay
Dubai’s central business district along the Dubai Canal, and one of the most active rental markets in central Dubai. Residential prices are +10.2% year on year against +10.4% for Dubai; 9,832 new apartment leases were registered over 12 months (+7%).
Key Mavens Group in this submarketTerraces Marasi Drive
04Retail market
Retail rents are measured as the median annual rent per sq ft of registered shop contracts, new and renewed, over 12 months. For neighbourhood retail, the size of the surrounding resident base and the rents achieved in comparable locations are the primary indicators of tenant demand.
Source: Dubai Land Department, registered rent contracts (new and renewed).
| Submarket | Shop rent AED / sq ft a year |
y-o-y | vs Dubai median | Apartment leases 12 months |
|---|---|---|---|---|
| Dubai | 177 | +10.0% | – | 554,218 |
| Liwan (Wadi Al Safa 2) | 237 | +1.5% | +34% | 4,757 |
| The Villa (Wadi Al Safa 5) | 143 | −7.7% | −19% | 8,137 |
Apartment leases: all registered apartment rent contracts in the community over 12 months, an indicator of the resident base. Source: Dubai Land Department; Key Mavens Group Research.
Liwan
A fast-growing residential district in Wadi Al Safa 2, home to Le Meryeme – Liwan, a 113,000 sq ft community mall anchored by LuLu and scheduled to open in the second quarter of 2027. Shop rents average AED 237 per sq ft a year, above the Dubai median of AED 177, with 4,757 apartment leases registered in the community over 12 months.
Key Mavens Group in this submarketLe Meryeme – Liwan
The Villa
An established villa community in Wadi Al Safa 5, served by Le Meryeme – The Villa. Shop rents average AED 143 per sq ft a year, below the Dubai median of AED 177, with 8,137 apartment leases registered in the community over 12 months.
Key Mavens Group in this submarketLe Meryeme – The Villa
05Outlook
- Durability of the ceasefire through the summer, and its effect on buyer confidence.
- Off-plan continues to dominate sales, placing a premium on developer delivery record and build quality.
- Leasing activity, which remains steady and continues to underpin values.
Methodology
All transaction and rent data are Dubai Land Department (DLD) open data. Residential prices: median price per sq ft of registered residential sales over rolling 12-month periods. Rents: median annual rent per sq ft of registered rent contracts, new and renewed, over 12 months. Recent months may be revised as late registrations are recorded; rents in smaller communities rest on fewer contracts. DLD area names: Al Jadaf (Al Jaddaf), Business Bay, Wadi Al Safa 2 (Liwan), Wadi Al Safa 5 (The Villa). Macro context is attributed to the sources named in the text.
Disclaimer
This report is published for general information only. It does not constitute investment, financial, legal or tax advice, or an offer or solicitation to buy, sell or lease any property. While prepared from sources believed to be reliable, no representation or warranty is given as to its accuracy or completeness, and Key Mavens Group accepts no liability for any loss arising from its use. Past performance is not a reliable indicator of future results.
Research and media enquiries: contact Key Mavens Group.
Newsroom
More from the group
-
 Key Mavens Group ResearchIssue 06Dubai Property Market ReportOctober2026
Dubai Property Market Report: October 2026
Read →
-
 Key Mavens Group Signs LuLu Retail as Anchor Tenant at Le Meryeme Mall – Liwan
Read →
-
 Key Mavens Group ResearchIssue 05Dubai Property Market ReportSeptember2026
Dubai Property Market Report: September 2026
Read →